Azure – Remote debugging on an Azure VM
Hello Everybody,
Today in this blog, we will go ahead with our last blog Azure – Deploying a Web App to Azure Virtual Machine with Web Deploy method and remotely debug our last solution on an Azure VM. Let’s follow the below steps !!!
- Let’s Login to our latest created Virtual Machine “ManasDevew”. Once the VM started, open/create the Web Application and build the solution in debug mode. Once we build our web application successfully, the next step is to verify the Default Web Site after published the solution using Web Deploy, as shown in the following figure.

Figure 1: Azure Certification 70-532 – My Test Azure Web App - Cloud Explorer for Visual Studio 2015/2017 enables you to view your Azure resources and resource groups, inspect their properties, and perform key developer and diagnostics actions from within Visual Studio.Cloud Explorer understands resources such as Azure resource groups and Azure services such as Logic apps and API apps, and it supports role-based access control (RBAC).To view the resources associated with an Azure account, you must first add the account to Cloud Explorer and manage your account by providing your Azure subscription credential, as shown in the following figures.
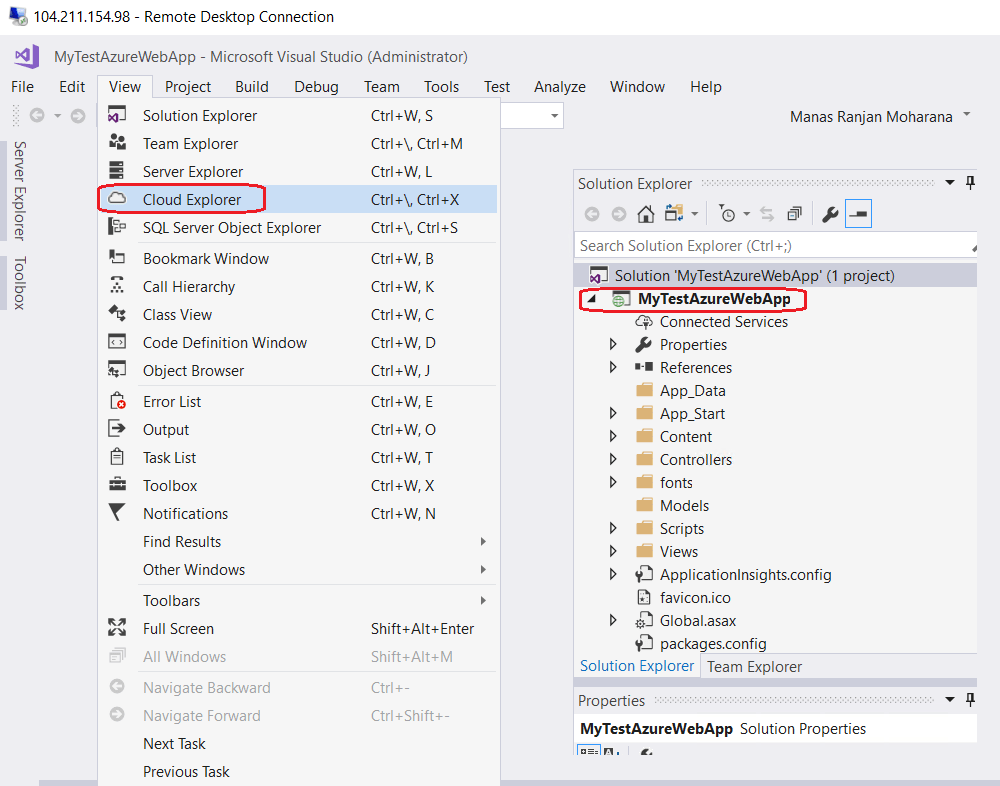
Figure 2: Azure Certification 70-532 – Open Cloud Explorer
Figure 3: Azure Certification 70-532 – Connect to Azure Account subscription - After successfully connect to our Azure account, Cloud Explore will list all our existing resources under our selected Azure subscription.Expand Virtual Machine section , we can found our all available VM. In the following figure, we can see our existing VMs. To continue debug on VM, we need to select one VM from the VM list.Here I have selected “ManasDevew” VM. After VM selected, scroll a little down and click on Enable Debugging link as shown in the following figure.

Figure 4: Azure Certification 70-532 – Enabled Debugging on VMp - When Configuring the VM to Enable Debugging, in background , Azure will deploy new extension on the selected Virtual Machine. So that the VM will be fully support remote debugging.We can see the installed extension, as shown in the following figure.
- Once we have configured the VM let’s browse our Default Web Site before start attaching the debugger, as shown in the following figure.
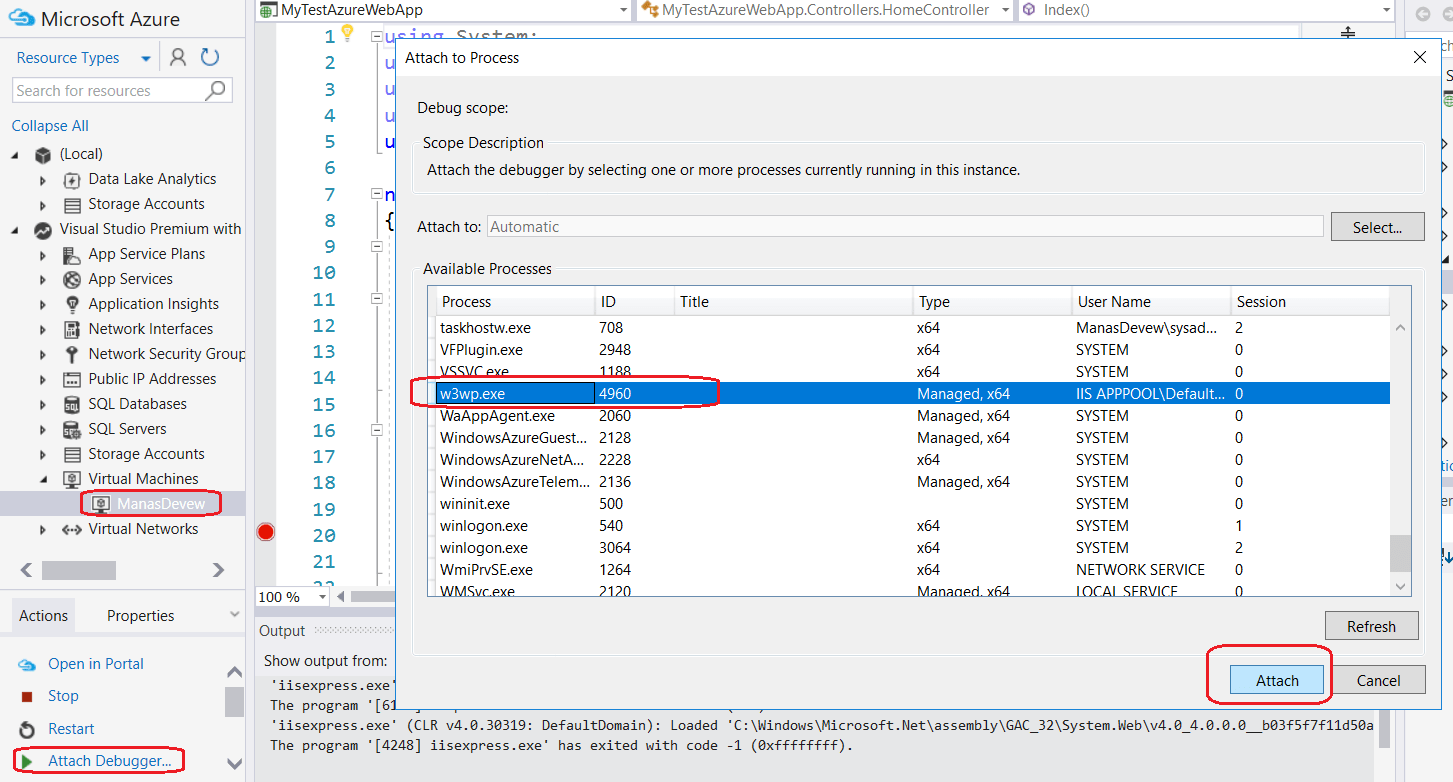
- Now we are ready to go for our remote debugging. As shown in the following figure, Click on Attach Debugger.. link and attach W3Wp process.Then put break point, some where in the code.In our case, we have put our break poing in the controller class .
- After debugger attached , let’s navigate and do some activity on our Default Web Site, like navigate different section or page of the site. The debugger will hit the break pint as shown in the following figure.

Figure 7: Azure Certification 70-532 – Debug Solution on Azure VM


Thanks for reading 🙂
Keep reading, share your thoughts, experiences. Feel free to contact us to discuss more. If you have any suggestion / feedback / doubt, you are most welcome.
Stay tuned on Knowledge-Junction, will come up with more such articles.
More Posts On Exam : Developing Microsoft Azure Solutions :
Azure – Working with Azure CLI
Azure – Create a Virtual Machine with Azure Power Shell
Azure – Deploying a Web App to Azure Virtual Machine with Web Deploy method
Azure – Azure Automation State Configuration
Azure – Configure Azure PowerShell Desired State Configuration (DSC) Through Azure Portal


good